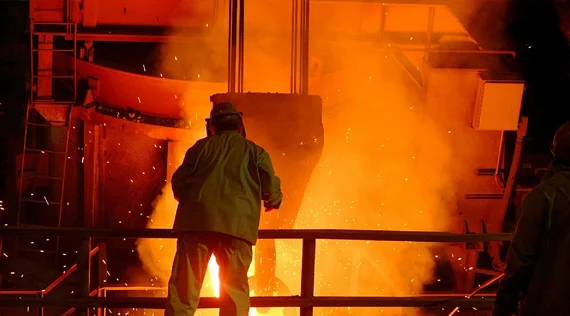
SEATTLE (Scrap Monster): The World Steel Association (worldsteel) has released the list of top steel producing nations in 2016. China continued to remain as the world’s top steel producer during the year, followed by Japan and India in second and third spot.
According to latest statistics, the world crude steel output by 66 countries reporting to the Association totaled 1.604 billion tonnes during the entire year 2016. The yearly output increased marginally by 0.7% when compared with the previous year. The output had totaled 1.592 billion tonnes during 2015.These 66 countries accounted for approximately 99% of the total world crude steel production in 2015.
The Chinese output increased slightly by 1.2% to total 808.40 Mt in 2016. The country’s crude steel production had totaled 798.8 Mt in 2015. In second place was Japan with production totaling 104.8 Mt. The output by the country dropped marginally by 0.3% over the previous year when compared with 105.1 Mt output recorded during 2015. The third largest steel producer during 2016 was India. The country’s output surged higher by 7.4% from 89 Mt during 2015 to 95.6 Mt during 2016.
The following table lists world’s top ten nations with regards to total crude steel output during 2016.
Rank | Nation | Output |
1 | China | 808.4 |
2 | Japan | 104.8 |
3 | India | 95.6 |
4 | United States | 78.6 |
5 | Russia | 70.8 |
6 | South Korea | 68.6 |
7 | Germany | 42.1 |
8 | Turkey | 33.2 |
9 | Brazil | 30.2 |
10 | Ukraine | 24.2 |
Note: The above output is in million tonnes (Mt).
Region-wise, Asia continued to remain as the largest producer. The Asian region’s output totaled 1.125 billion tonnes, higher by 1.6% when matched with the production of 1.108 billion tonnes in 2015. Out of this, China and Japan accounted for 808.4 Mt and 104.8 Mt of crude steel production respectively.
Europe’s production witnessed marginal decline of 0.3% from 303.8 Mt in 2015 to 302.8 Mt in 2016. Out of this, EU-28 region produced 162.3Mt, whereas CIS region accounted for 102.4 Mt. The North American output remained more or less flat over the previous year to 111 Mt in 2016. The major producer in the region was the US. The production by the US was down slightly by 0.3% year-on-year to 78.6 Mt in 2016.
The South American output tumbled by 10.6% over the previous year to total 39.2 Mt in 2016. The African output too plunged by 4.4% from 13.7 Mt in 2015 to 13.1 Mt in 2016. On the other hand, Middle East region reported strong growth in steel production during 2016. The output by the region rose by 7.0% to 31.5 Mt, when matched with the previous year. A 2.1% jump in production was reported by the Oceania region during 2016.
The following table provides a year-on-year comparison of crude steel output by major regions across the world.
Region | Output in 2016 | Output in 2015 | Variation (%) |
Europe | 302.8 | 303.8 | -0.3 |
North America | 111.0 | 110.9 | Nil |
South America | 39.2 | 43.9 | -10.6 |
Africa | 13.1 | 13.7 | -4.4 |
Middle East | 31.5 | 29.4 | +7.0 |
Asia | 1,125.1 | 1,107.8 | +1.6 |
Oceania | 5.8 | 5.7 | +2.1 |
Note: The above output is in million tonnes (Mt).
The average crude steel capacity utilization ratio of the 66 countries in 2016 was 69.3%, marginally lower when compared with the capacity utilization rate of 69.7% in 2015.
The table below provides the capacity utilization rates during the course of the year 2015.
Month in 2016 | Rate (%) |
Jan | 65.5 |
Feb | 66.7 |
Mar | 70.9 |
Apr | 71.5 |
May | 71.5 |
Jun | 72.1 |
Jul | 68.4 |
Aug | 68.6 |
Sep | 70.3 |
Oct | 69.7 |
Nov | 69.4 |
Dec | 68.1 |


| Copper Scrap View All | |
| Alternator | 0.40 (0) |
| #1 Copper Bare Bright | 4.20 (0.03) |
| Aluminum Scrap View All | |
| 356 Aluminum Wheels (Clean) | 0.81 (0) |
| 6061 Extrusions | 0.71 (0) |
| Steel Scrap View All | |
| #1 Bundle | 360.00 (0) |
| #1 Busheling | 380.00 (0) |
| Electronics Scrap View All | |