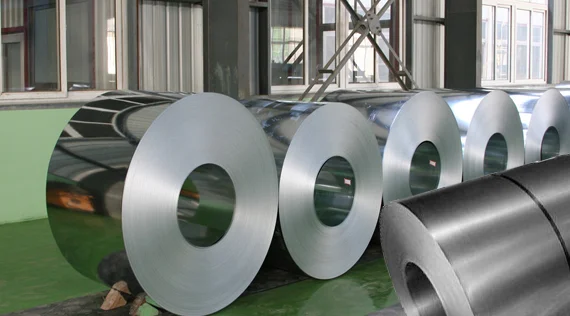
SEATTLE (Scrap Monster): According to the recent statistics published by the American Iron and Steel Institute (AISI), the steel shipments by the U.S. mills recorded significant jump during April this year. This is upon comparison with the shipments during the same month a year before. However, the April ’18 shipments declined when matched with March ’18. The steel mill shipments had soared 8% in March this year.
The U.S steel mill shipments totaled 7.798 million net tons in April this year. The shipments declined heavily by 6% from the previous month. The U.S. steel mills had shipped 8.299 million net tons in March this year. The April ’18 shipments were up by 5.0% over the previous year. The shipments had totaled only 7.428 million net tons in the same month last year. The combined steel mill shipments during the initial four months of the year totaled 31.260 million net tons, modestly higher by 4.0% when compared with the shipments of 30.061 million net tons during Jan-Apr ’17.
Several products reported notable decline in shipments in April, upon comparison with the prior month. The shipments of cold rolled sheets have dropped by 6%. Hot dipped galvanized sheets and strip shipments recorded 6% decline over the previous month. The shipments of hot rolled sheets were down nearly 6% month-on-month.
ALSO READ: U.S. Finished Steel Imports to Decline Marginally in 2018
Meantime, the domestic raw steel production during the week ending June 9, 2018 totaled 1.753 million net tons. The capability utilization rate of US steel mills was 74.80% during the week. The weekly production was up by 0.3% when compared with the same period last year and was down marginally by 0.1% over the prior week. The district wise crude steel production during the week in thousands of net tons is as follows: North East- 201, Great Lakes-655, Midwest-178, Southern-645 and Western-74.
The cumulative production through June 9, 2018 was up marginally by 1.8% from 39.597 million net tons in 2017 to 40.321 million net tons in 2018. The U.S. mills recorded capability utilization rate of 75.5% during the year-to-date period.


| Copper Scrap View All | |
| Alternator | 0.40 (0) |
| #1 Copper Bare Bright | 4.17 (-0.03) |
| Aluminum Scrap View All | |
| 356 Aluminum Wheels (Clean) | 0.81 (0) |
| 6061 Extrusions | 0.71 (0) |
| Steel Scrap View All | |
| #1 Bundle | 360.00 (0) |
| #1 Busheling | 380.00 (0) |
| Electronics Scrap View All | |